
DAX In Power BI - Show Aggregate Sum Value Of The Previous N Months Within Same Table

Overview
In this article, we will learn how we can show the aggregate value of the previous number of months within the same table in Power BI using Measures.
Scenario
I have a scenario, in which I have one table that has Cash and Charge values in a table. I want to show a monthly sum of charges. I also want to show the sum of charges from the previous month as well as the previous two months within the table. Please refer to the following output screen.

Let’s say there is a month, for instance May, and for May the previous month is April and the month before that is March.
So, I need the end result as – For May – current month charges are 660, previous month charges are 1237 ( which is similar to April’s charges) and the second previous month charges are 113 (of March).
In order to achieve this, we have created some calculated columns, calendar tables, and measures.
I have added a sample file for your reference on the GitHub. You can directly download the sample Power BI file and the data source file using this link - Download Example.
Let’s get started!
Step 1
Create a Calendar table. To create a calendar table, go to the Modeling pane and click on the "New Table" option.
Add the following formula.
  1. DateMaster = CALENDAR(DATE(2017,1,1),DATE(2018,12,31))  
The above formula will create each day of the calendar as row value in DateMaster table.
Step 2
Create the following calculated column to find out the month start date for each transaction date.
  1. vMonthStartDate = STARTOFMONTH(Cash[TRDate].[Date])  
The above formula will return the start date of the transaction date, which we will use as relationship column in Step 3.
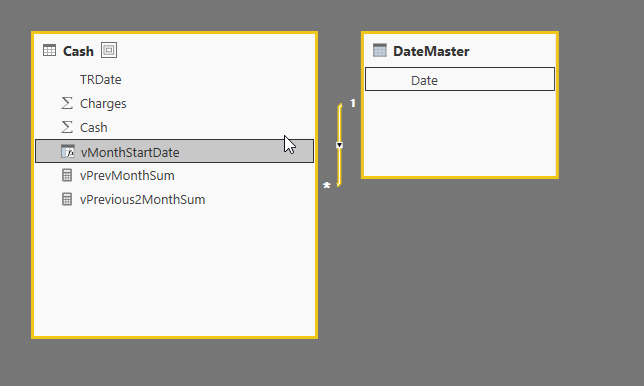
Step 3
Create a relationship between Cash and CalendarMaster table.
We will apply one-to-many relationship between the Date columns of CalendarMaster and vMonthStarDate of Cash table.


Step 4
Create a measure which will find the previous month's sum.
  1. vPrevMonthSum = CALCULATE(  
  2.    SUM('Cash'[Charges]),  
  3.    DATEADD(DateMaster[Date].[Date], -1, MONTH)  
  4. )  
If we look into the formula closely - the above formula will calculate the sum for the previous one month.
The same way, we will prepare the formula to show the sum of the charges for the second previous month.
  1. vPrevious2MonthSum = CALCULATE(  
  2.    SUM('Cash'[Charges]),  
  3.    DATEADD(DateMaster[Date].[Date], -2, MONTH)  
  4. )  

  
Step 5
Now, let’s add all the values in the table and check the end result.
Here is the result which will show Current Month Charges, Previous 1 month and Previous 2 month charges.

Conclusion
This is how we can show previous months data with a visual table of Power BI.
Hope you love this article! Stay connected with me for such articles.
 

Comments

Popular posts from this blog

How to partition or split DataTable in C#?

Today we will discuss how we can divide or split a very large data table into fixed size of chunks? Scenario: Suppose there is a data table which has 1000 Rows. When you perform for each loop on data table and read each row at that time it will take too much time. If we devide 1000 Rows datatable into 10 fixed sizes (e.g. 100 Rows) datatable, It will take less time. Let's check how to achieve it. Here is a code. private static List<DataTable> SplitTable(DataTable originalTable, int batchSize) { List<DataTable> tables = new List<DataTable>(); int i = 0; int j = 1; DataTable newDt = originalTable.Clone(); newDt.TableName = "Table_" + j; newDt.Clear(); foreach (DataRow row in originalTable.Rows) { DataRow newRow = newDt.NewRow(); newRow.ItemArray = row.ItemArray; newDt.Rows.Add(newRow); i++; if (i == batchSize) ...

How To Lock Objects In Power BI

Overview Sometimes, there is a situation where when we open a report and click on any visual it accidentally nudges a chart a little bit to the right or left. Sometimes, by mistake when viewing a report, the arrangement of visuals scatters a little bit. Microsoft rolls out one new amazing feature to resolve this issue, that is, Lock Objects in Power BI. Advantages of using this feature When our purpose is to only view a report, this feature is a boon for us. Visualization’s position is not changed. Saves a lot of the developer's time to resolve the position related issues. Note   -  This feature is not saved with the report. So, every time you open a report, you need to enable this feature. Now, let’s understand this feature in a brief manner. To understand this, I will first show you one report in which I have not enabled “Lock Objects” feature. Step 1 The below screenshot shows my report which doesn’t have the enabled Lock Objects feature. ...

Use SharePoint Online List As A Data Source In Power BI

Introduction In this article, we will check how we can use SharePoint List as a data source in Microsoft Power BI. Please follow the below steps to establish the connection of SharePoint Online list with Power BI.  Step 1 Open Power BI Desktop > Get Data > Click More.   Step 2 Search for SharePoint > SharePoint Online List.   Step 3 Enter the URL of your SharePoint site.   Step 4 Click on Organizational account > Sign In.   Step 5 It will open the screen of Office 365 Login > Enter Credentials.   Step 6 Click on Connect.   Step 7 It will show all the lists available in the SharePoint - lists are on the left corner and their preview is on the right. Select all the lists which you want to use directly in the Power BI. Click on Load.   Step 8 It will load all the lists. Expand "Fields" column to view all the fields shown in the SharePoint List.   We can also view all the...