Overview
Microsoft recently added one interesting feature in Power BI, i.e., Selection Pane. This is an amazing preview feature rolled out by the company during the October update. Before we start, we may have a question in our mind how this feature will be helpful to us.
Suppose, I have added 10 visuals in my single page of the report and while publishing this report, I only want to show 8 visuals. I want to hide other two visuals. This is where the selection pane feature comes handy.
Secondly, we can combine this feature with Bookmark Pane feature. For every bookmark in a bookmark pane, Power BI provides one selection pane. Sometimes, when we perform slideshow to the client with Power BI Desktop, we can hide unnecessary visuals within a click to focus a specific visual.
Now, let us check its amazing functionality!
In this article, steps 1 to 5 focus on the Selection Pane only.
Then, from Step 6 onward, we combine this Selection Pane feature with Bookmark Pane for better understanding. I prefer you to go through my previous article - Power BI New Feature: Bookmark Pane in Power BI (Preview Feature).
Prerequisites to enable this feature
- Latest version of Power BI Desktop
- Enable Preview Feature for bookmark ( To know how to enable preview feature in Power BI Desktop, visit my blog)
Step 1
Make sure the Bookmark Preview feature is enabled. To check, go to File > Options and Setting > Option > Preview Feature > Bookmark.
Make sure that the "Bookmarks" option is checked.

Step 2
If we have enabled this option, it provides us two panes under View option.
- Bookmark Pane
- Selection Pane

Step 3
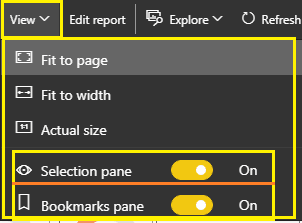
Go to View > Check "Selection Pane".

It will add the Selection pane just after the Visualizations tab.

Step 4
If we observe, the selection pane has two options.
- Show All – Used to show all visuals
- Hide All – Used to hide all visuals
- Along with this, it is showing all available visuals with visibility (glass icon right side) – We can hide specific visuals using this glass icon.

Step 5
Now, I want to hide the able visual.
So, I will close visibility icon of “September Tweet Records”. So, my table visual is now in hidden mode and my glass icon is converted into minus (-) icon.

If we want to show it again, click on (-) icon. The visual will appear.

Step 6
For better understanding and use of this Selection pane feature, let’s combine this feature with Bookmarks pane. In my previous article, we have created Bookmarks pane with 5 bookmarks added. Power BI shows Selection pane with all available visuals for each bookmark.
For every bookmark, we can hide and show visuals.

Step 7
Now, for the first bookmark, let’s hide the table visual.

For the second bookmark, let’s hide pie chart.

Remember: For each bookmark, it will not remember its previous state which means if we move to the next slide, the previous slide’s visuals are automatically shown.
Step 8
Selection Pane remembers its state at page level.
Bookmark pane remembers its state at page level as well as at the report level.
Step 9
Let’s publish a report. Now, let’s enable bookmark pane in Power BI published report.
Click View > Enable Selection Pane.
It will add a Selection pane. But here comes one limitation that I face, i.e., it will not provide the feature of show or hide visuals after publishing a report.

Conclusion
This is how this new preview feature, Selection Pane, works!
Comments
Post a Comment