
Power BI New Feature - Bookmarks Pane In Power BI (Preview Feature)

Overview
Microsoft recently added one interesting feature in Power BI - the Bookmarks Pane. This is an amazing preview feature rolled out by Microsoft during the October update. Before we start, we should know how this feature will be helpful to us.
As we all know, in a browser, we use bookmarks to retain some useful and important URLs. In Power BI, if we have applied the slicer to a report and want to store the current filtered report, we can store it as a bookmark.
We can store multiple bookmarks in Power BI desktop. Also, we can represent it as a slideshow. This feature proves very helpful to me when presenting a report to the client.
Now, let's check its amazing functionality!
Prerequisites to enable this feature
  • Latest version of Power BI Desktop
  • Enable Preview Feature for bookmark ( To know how to enable preview feature in Power BI Desktop visit my Blog)
Step 1
Make sure, the Bookmark preview feature is enabled. To check, go to File > Options and Settings > Options > Preview Features > Bookmark.
Make sure the Bookmark option is checked.

 
Step 2
If we have enabled this option, it provides us two panes under View option.
  • Bookmarks Pane
  • Selection Pane
We have discussed the Selection pane in another article.

 
Step 3
Go to View > Check the Bookmark Pane box.
It will add the Bookmark pane just after Visualization tab.


Step 4
If we observe the bookmarks pane, it has two options.
  • Add
  • View
Now, let’s understand both of them more closely.

Step 5
First, I want to retain the state of current report so I will add it as bookmark and give the bookmark name as Current Report.
Click on the "Add" button.

 
Bookmark1 is added.

 
Double click on bookmark1 and rename it as Current Report.

 
Step 6
Now, I will apply the date filter. I want to see the data of the first week of September, so I applied date slicer.

 
Now, I want to store this filtered report. So, I will add the same as bookmark and rename it as first week of September.

 
Step 7
Now, I will filter the data for the second week of September and bookmark it.


Step 8
We will repeat the same procedure for week 3 and week 4.


Step 9
Now, let’s view all the saved bookmarks.
Click on "View" option from the Bookmarks pane.

 
It will add a slider like this.

The slider has the following functionality.
  • Next
  • Previous
  • Close
  • Book mark name.
Now, we will move each slide and check the result.
Slide 1

 
Slide 2 

 
Slide 3 

 
Slide 4 

 
Slide 5 
 
Step 10
Now, let's exit from the slideshow.

So, click on X button from the slider or click on Exit button from Bookmarks pane.
Step 11
Let’s publish a report.

Now, let’s enable the Bookmarks pane in Power BI-published report.
Click View > Enable Bookmark Pane.

 
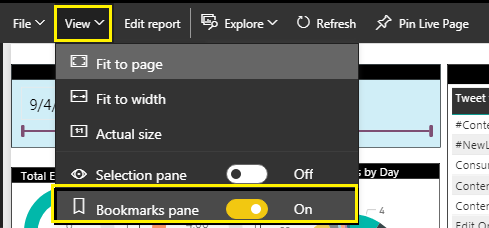
It will add the Bookmarks pane and we can use the same feature online.

Conclusion
This is how this new preview feature Bookmark Pane works!

Comments

Popular posts from this blog

How to partition or split DataTable in C#?

Today we will discuss how we can divide or split a very large data table into fixed size of chunks? Scenario: Suppose there is a data table which has 1000 Rows. When you perform for each loop on data table and read each row at that time it will take too much time. If we devide 1000 Rows datatable into 10 fixed sizes (e.g. 100 Rows) datatable, It will take less time. Let's check how to achieve it. Here is a code. private static List<DataTable> SplitTable(DataTable originalTable, int batchSize) { List<DataTable> tables = new List<DataTable>(); int i = 0; int j = 1; DataTable newDt = originalTable.Clone(); newDt.TableName = "Table_" + j; newDt.Clear(); foreach (DataRow row in originalTable.Rows) { DataRow newRow = newDt.NewRow(); newRow.ItemArray = row.ItemArray; newDt.Rows.Add(newRow); i++; if (i == batchSize) ...

How To Lock Objects In Power BI

Overview Sometimes, there is a situation where when we open a report and click on any visual it accidentally nudges a chart a little bit to the right or left. Sometimes, by mistake when viewing a report, the arrangement of visuals scatters a little bit. Microsoft rolls out one new amazing feature to resolve this issue, that is, Lock Objects in Power BI. Advantages of using this feature When our purpose is to only view a report, this feature is a boon for us. Visualization’s position is not changed. Saves a lot of the developer's time to resolve the position related issues. Note   -  This feature is not saved with the report. So, every time you open a report, you need to enable this feature. Now, let’s understand this feature in a brief manner. To understand this, I will first show you one report in which I have not enabled “Lock Objects” feature. Step 1 The below screenshot shows my report which doesn’t have the enabled Lock Objects feature. ...

Create Event Calendar In Power BI

Overview In this article, we will learn how we can create Event Calendar within Power BI. We have a requirement from many of my clients to show Events within the Calendar by Category Colors. In order to achieve that requirement, we can use the custom visual from the marketplace which is “ Calendar by MAQ Software ”. You can directly download it using   URL . At the end of the article, you are able to create Event Calendar as shown in the following screenshot. We have the following data to be shown in the event Calendar. Event Start Date Event End Date Description Category   For your practice, you can download sample data source file and Power BI file using   GitHub . Let’s get started! Step 1 Import “ Calendar by MAQ Software ” from Marketplace or download using the   URL . Once it is imported we can see the visual in visualization pane. Step 2 Drag the “ Calendar by MAQ Software ” visual and set the following property. ...