
Find Dense Rank By Average Value In Power BI

Overview
In this article, we will learn how we can add the "Continues Rank by Average" value in Power BI.
Scenario
We have two tables with a One to Many Relationship.
  • Facility-Doctor
  • WaitTime
Please refer to the following relationship diagram.
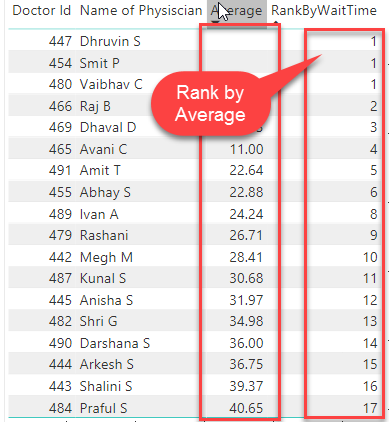
 We need to give a Rank to all the Physicians by their Average Wait Time. The end result that we want here is, tabular data with Physician Name, Average Wait Time, and Rank of their Average Wait Time.

For your practice, I have attached the dataset sample and Power BI file on GitHub. You can download it using the following URL. Download Sample Files
The same article is available in video form. You can watch the video using this link.
Power BI facilities apply Rank functionality using RANKX() function. Now, let’s get started!
Step 1
Create a Measure in Facility-Doctor Table to find an Average.
  1. Average = AVERAGE(WaitTime[Waiting Time Per Appointment])
  
Step 2
Apply RANKX function to find out the Rank.
Here, we will use RANKX function to add the Rank Number.
Syntax
  1. RANKX(<table>, <expression>[, <value>[, <order>[, <ties>]]])
Here,
  • Table = The name of the table on which we need to apply our DAX expression.
  • Expression = Any DAX Expression that returns a single scalar value.
  • Value = Optional
  • Order = ASC/DESC
  • Tiles = An enumeration that defines how to determine ranking when there are ties. Values for the tiles are: DENSE/SKIP
In our case, we will use following DAX expression which is RANKX().
  1. RankByWaitTime = RANKX(ALL('Facility-Doctor'),[Average],,ASC,Dense)
 
 
Here,
  • ALL('Facility-Doctor') = We need to evaluate our entire DAX expression on Facility-Doctor table without allowing any filters. That’s why we have used this expression.
  • [Average] = Find Average for every Physician.
  • We have already mentioned the formula for the Average in Step 1 as well.
  • ASC = To sort the Rank in Ascending order.
  • Dense= We want to show continuous Rank so we have used Dense Rank here.
Step 3
Now, let’s test the function.
Add the value in the Table visual.
We have a result like this.
Conclusion
This is how we can apply the Dense Rank within Power BI.
I hope you love this article! Stay connected with me for more amazing articles like this.

Comments

Popular posts from this blog

How to partition or split DataTable in C#?

Today we will discuss how we can divide or split a very large data table into fixed size of chunks? Scenario: Suppose there is a data table which has 1000 Rows. When you perform for each loop on data table and read each row at that time it will take too much time. If we devide 1000 Rows datatable into 10 fixed sizes (e.g. 100 Rows) datatable, It will take less time. Let's check how to achieve it. Here is a code. private static List<DataTable> SplitTable(DataTable originalTable, int batchSize) { List<DataTable> tables = new List<DataTable>(); int i = 0; int j = 1; DataTable newDt = originalTable.Clone(); newDt.TableName = "Table_" + j; newDt.Clear(); foreach (DataRow row in originalTable.Rows) { DataRow newRow = newDt.NewRow(); newRow.ItemArray = row.ItemArray; newDt.Rows.Add(newRow); i++; if (i == batchSize) ...

How To Lock Objects In Power BI

Overview Sometimes, there is a situation where when we open a report and click on any visual it accidentally nudges a chart a little bit to the right or left. Sometimes, by mistake when viewing a report, the arrangement of visuals scatters a little bit. Microsoft rolls out one new amazing feature to resolve this issue, that is, Lock Objects in Power BI. Advantages of using this feature When our purpose is to only view a report, this feature is a boon for us. Visualization’s position is not changed. Saves a lot of the developer's time to resolve the position related issues. Note   -  This feature is not saved with the report. So, every time you open a report, you need to enable this feature. Now, let’s understand this feature in a brief manner. To understand this, I will first show you one report in which I have not enabled “Lock Objects” feature. Step 1 The below screenshot shows my report which doesn’t have the enabled Lock Objects feature. ...

Create Event Calendar In Power BI

Overview In this article, we will learn how we can create Event Calendar within Power BI. We have a requirement from many of my clients to show Events within the Calendar by Category Colors. In order to achieve that requirement, we can use the custom visual from the marketplace which is “ Calendar by MAQ Software ”. You can directly download it using   URL . At the end of the article, you are able to create Event Calendar as shown in the following screenshot. We have the following data to be shown in the event Calendar. Event Start Date Event End Date Description Category   For your practice, you can download sample data source file and Power BI file using   GitHub . Let’s get started! Step 1 Import “ Calendar by MAQ Software ” from Marketplace or download using the   URL . Once it is imported we can see the visual in visualization pane. Step 2 Drag the “ Calendar by MAQ Software ” visual and set the following property. ...