
DAX In Power BI - How To Use LOOKUPVALUE() Function

Overview
In this article, we will talk about one important DAX function which is LOOKUPVALUE function. Here, we will consider one example and learn about it in detail.
Now, let’s get started!
Let’s consider this scenario. We have two tables in our dataset.
  • Employee Information
  • Master Table for Country-State
  
Scenario
Here, in the Employee Information table, I have the name of the State. Now, I want to derive the name of the country from the Master table. In order to achieve this requirement, I need to search for the name of the state from “Employee Information” table and look into “Master table” which will retrieve the name of the country from it. For that, we will use LOOKUPVALUE function in Power BI.
For your reference, I have added the data source file and Power BI file on GITHUB. Download using URL.
Syntax for the LOOKUPVALUE function
LOOKUPVALUE(Result_ColumnName, Search_ColumnName1, Search_Value1)
Here,
  • Result_ColumnName = Name of the column which you want to show as an end result. In our case, we want to display the name of the Country from Master table.
  • Search_Column1 = Name of the column from where you want to find your keyword/string. In our case, we want to search the value of State from Master table.
  • Search_Value1 = Name of the column or value which you want to use as LookUpValue search. In our case, we want to search for the state in Employee Information table.
In short, State from the Employee Information table will look into State from Master table and display the value of the Country from it.
Below is a Power BI diagram for the loaded table.
 
Right now, we have the following table value from the Employee Information table.
 
 
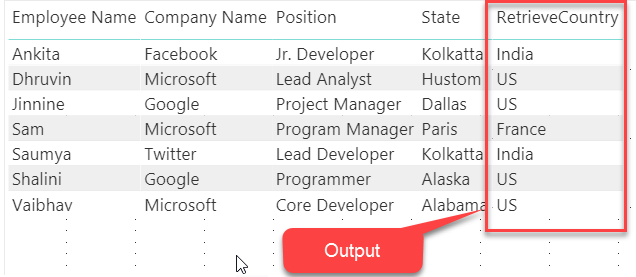
Now, let’s apply following DAX formula to retrieve the country name.

RetrieveCountry = LOOKUPVALUE(MasterTable[Country],MasterTable[State],EmployeeInformation[State])
Below is the result of the above DAX formula:

 
Conclusion
This is how we can prepare use the LOOKUPVALUE() function in Power BI.
I hope you love this article!
Stay connected with me!

Comments

Post a Comment

Popular posts from this blog

How to partition or split DataTable in C#?

Today we will discuss how we can divide or split a very large data table into fixed size of chunks? Scenario: Suppose there is a data table which has 1000 Rows. When you perform for each loop on data table and read each row at that time it will take too much time. If we devide 1000 Rows datatable into 10 fixed sizes (e.g. 100 Rows) datatable, It will take less time. Let's check how to achieve it. Here is a code. private static List<DataTable> SplitTable(DataTable originalTable, int batchSize) { List<DataTable> tables = new List<DataTable>(); int i = 0; int j = 1; DataTable newDt = originalTable.Clone(); newDt.TableName = "Table_" + j; newDt.Clear(); foreach (DataRow row in originalTable.Rows) { DataRow newRow = newDt.NewRow(); newRow.ItemArray = row.ItemArray; newDt.Rows.Add(newRow); i++; if (i == batchSize) ...

How To Lock Objects In Power BI

Overview Sometimes, there is a situation where when we open a report and click on any visual it accidentally nudges a chart a little bit to the right or left. Sometimes, by mistake when viewing a report, the arrangement of visuals scatters a little bit. Microsoft rolls out one new amazing feature to resolve this issue, that is, Lock Objects in Power BI. Advantages of using this feature When our purpose is to only view a report, this feature is a boon for us. Visualization’s position is not changed. Saves a lot of the developer's time to resolve the position related issues. Note   -  This feature is not saved with the report. So, every time you open a report, you need to enable this feature. Now, let’s understand this feature in a brief manner. To understand this, I will first show you one report in which I have not enabled “Lock Objects” feature. Step 1 The below screenshot shows my report which doesn’t have the enabled Lock Objects feature. ...

Create Event Calendar In Power BI

Overview In this article, we will learn how we can create Event Calendar within Power BI. We have a requirement from many of my clients to show Events within the Calendar by Category Colors. In order to achieve that requirement, we can use the custom visual from the marketplace which is “ Calendar by MAQ Software ”. You can directly download it using   URL . At the end of the article, you are able to create Event Calendar as shown in the following screenshot. We have the following data to be shown in the event Calendar. Event Start Date Event End Date Description Category   For your practice, you can download sample data source file and Power BI file using   GitHub . Let’s get started! Step 1 Import “ Calendar by MAQ Software ” from Marketplace or download using the   URL . Once it is imported we can see the visual in visualization pane. Step 2 Drag the “ Calendar by MAQ Software ” visual and set the following property. ...